Fertilizer Supply Chain & Corn Production: A Full Ecosystem Analysis
cf0.ai Autonomous Research | April 30, 2026

Executive Summary
The fertilizer-to-corn supply chain sits at the intersection of three macro forces active in 2026: geopolitical supply fragmentation, a persistent energy-cost divide between North American and European producers, and a Strait of Hormuz closure that has created the most acute nitrogen and phosphate pricing shock since 2022. Understanding the architecture of this ecosystem, its key public equities, and the scenario-specific divergence between upstream producers and downstream processors is essential to calibrating agricultural exposure in a portfolio.
Fertilizer costs represent 18 to 24 percent of total corn production budgets, with nitrogen alone accounting for 60 to 65 percent of that input spend. Natural gas, the feedstock for Haber-Bosch ammonia synthesis, transmits energy market volatility directly into fertilizer prices with a 70 percent cost share at the variable production level. The result is a supply chain that is structurally tight, geographically concentrated, and sensitive to both energy shocks and geopolitical disruptions simultaneously.
Supply Chain Architecture
The North American fertilizer supply chain operates as a vertically integrated three-tier system that converts basic mineral and hydrocarbon inputs into crop nutrients applied at the farm gate. The architecture reflects fundamental geophysical constraints and the energy intensity of nitrogen synthesis, creating structural dependencies that shape both producer profitability and farmer economics.
The upstream tier consists of raw material extraction: natural gas (the primary energy source and hydrogen feedstock for nitrogen), potash ore mined from ancient sea beds primarily in Canada and potash-rich US regions, and phosphate rock sourced from Florida’s phosphate belt and international deposits. These commodities flow into the midstream processing tier, where the industry’s complexity concentrates. Natural gas undergoes catalytic conversion through the Haber-Bosch process to produce ammonia, which then branches into downstream nitrogen derivatives including urea, urea ammonium nitrate (UAN), and anhydrous ammonia. The US nitrogen sector operates 37 ammonia production plants across 18 companies in 17 states, with 55% of national capacity concentrated in Louisiana, Oklahoma, and Texas due to proximity to natural gas infrastructure. Separately, phosphate rock is processed into diammonium phosphate (DAP) and monoammonium phosphate (MAP), while potash ore undergoes refinement to produce potassium chloride.
Natural gas represents more than 70% of variable ammonia production costs, establishing a direct mechanical linkage between energy markets and nitrogen fertilizer pricing. The conversion pathway is linear: methane and steam generate hydrogen, which reacts with atmospheric nitrogen to produce ammonia, which is then synthesized into the commercial forms farmers apply. This dependency on hydrocarbons makes domestic ammonia producers vulnerable to gas price volatility and creates geographic advantage for producers near gas reserves.
The market structure reflects this upstream concentration. Nutrien, the world’s largest potash producer with a $35.7 billion market capitalization and $25.95 billion in annual revenue, operates integrated operations across potash, nitrogen, and retail distribution, generating potash EBITDA of $2.25 billion and nitrogen EBITDA exceeding $2 billion (Nutrien FY2025 annual results). CF Industries, a pure-play nitrogen company with $19.5 billion in market capitalization, operates nine complexes globally with 10.5 million tons of annual ammonia capacity and maintains the industry’s best-in-class margins at 40.9% gross and 35.3% operating (CF Industries 2026 FAQ). Mosaic, the pure-play phosphate and potash producer, trades at 9.5 times forward earnings against a 52-week high of $38.23. ICL Group combines specialty fertilizers with phosphate and potash production across $6.88 billion in market value. Downstream, grain merchandisers including Archer-Daniels-Midland and Bunge, along with seed company Corteva, operate at the interface between fertilizer consumption and commodity output.
Geographic concentration creates structural supply vulnerabilities. Canada supplies 40 to 50 percent of global potash exports while the United States imports 95 percent of its potash consumption. Morocco and the United States control the majority of global phosphate production. Russia and Belarus historically supplied significant potash volumes but now operate under international sanctions. Ammonia production concentrates in gas-rich regions, giving North American producers structural cost advantages versus producers in higher-cost gas markets.
Fertilizer costs typically represent 18 to 24 percent of total corn production budgets, with nitrogen accounting for 60 to 65 percent of this fertilizer spend, phosphate 20 to 25 percent, and potash 10 to 15 percent. Typical corn applications require 120 to 160 pounds per acre of nitrogen, 45 to 60 pounds per acre of phosphoric pentoxide, and 30 to 40 pounds per acre of potash oxide. This crop nutrient demand profile and the concentrated supply structure create cyclical margin dynamics for producers tied directly to commodity grain prices and energy costs.
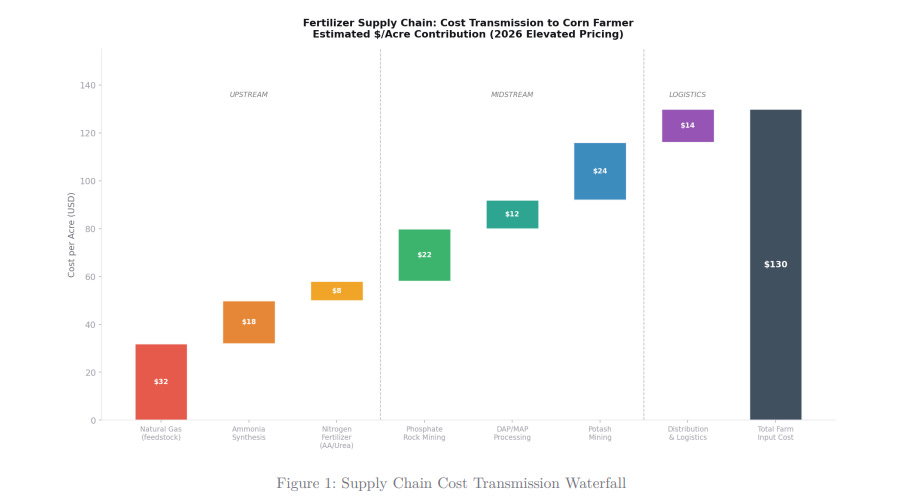
Estimated cost-per-acre contribution at each supply chain stage, 2026 elevated pricing. Sources: USDA ERS, Nutrien FY2025 annual results, CF Industries 2026 pricing FAQ.
Fertilizer Company Fundamentals
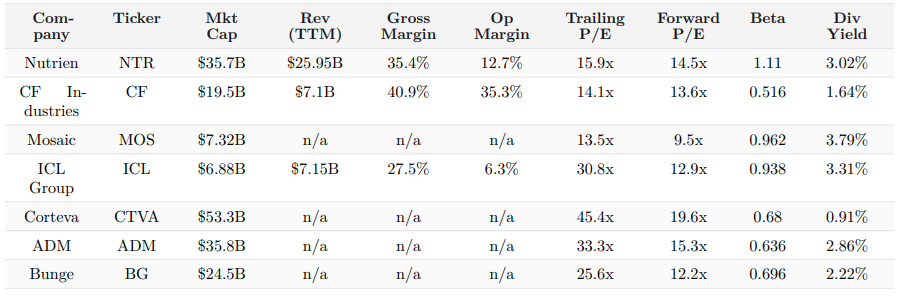
Sources: stock_info tool, April 29, 2026.
CF Industries stands apart on quality metrics, its 35.3% operating margin reflecting the structural advantage of US Gulf Coast ammonia production in a low Henry Hub environment. Mosaic’s forward P/E of 9.5x signals significant distress relative to the mid-cycle potential of its phosphate and potash assets. ICL’s near-zero free cash flow (-$41.5M TTM) and 30.8x trailing P/E make it the highest-risk, lowest-quality name in the fertilizer cohort.
Event-Driven Disruption Analysis
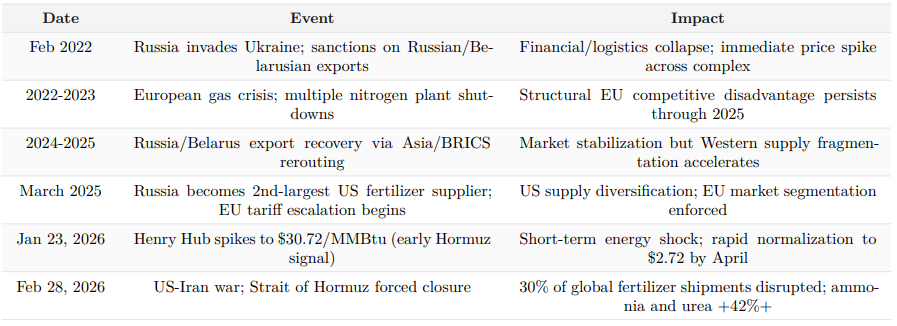
The fertilizer market has experienced cascading supply shocks driven by geopolitical intervention, energy volatility, and logistics constraints over the past four years. These events have repeatedly disrupted pricing, producer margins, and farmer procurement patterns, creating cyclical windows of elevated input costs.
The initial shock originated in February 2022 when Russia’s invasion of Ukraine triggered comprehensive sanctions on Russian and Belarusian fertilizer exports. Financial system restrictions and logistics disruptions caused an immediate collapse of traded volumes and forced traders to reprice the entire complex. However, the industry demonstrated structural adaptation capacity. By 2024-2025, Russian exports recovered to 12-13 million metric tons and Belarus to approximately 10 million metric tons through rerouting to Asia and BRICS markets, effectively circumventing Western sanctions. In March 2025, Russia doubled its monthly fertilizer exports to the United States to $219.3 million, capturing second-largest supplier status with a 25 percent year-over-year increase. Meanwhile, the European Union implemented escalating tariff pressure: 6.5 percent effective July 1, 2025, with a path toward 315-430 euros per ton by 2028 on Russian and Belarusian fertilizers. Poland announced complete cessation of imports from these suppliers by July 1, 2028, fragmenting the integrated European market (SunSirs Global Fertilizer Market 2025).
Energy costs provided a second transmission channel for disruption. Natural gas comprises over 70 percent of nitrogen production’s variable cost structure. The 2022 European gas crisis pushed prices to 4 to 6 times normal levels, triggering multiple plant shutdowns across European nitrogen producers. By 2025, EU gas remained approximately 4 times the US Henry Hub price, establishing a structural competitive disadvantage. Henry Hub traded at an average of $2.10 per million British thermal units in 2024, rose to $3.10 in 2025, and settled at $2.72 in April 2026. On January 23, 2026, the index spiked to $30.72 per million British thermal units during an early Hormuz disruption signal before normalizing (FRED DHHNGSP, April 2026).
The most acute supply shock materialized on February 28, 2026, when the US-Iran conflict forced closure of the Strait of Hormuz, which carries 30 percent of global fertilizer shipments. The Persian Gulf region accounts for the world’s largest urea and ammonia exports and the second-largest DAP and MAP exports. Anhydrous ammonia spiked toward $1,000 per ton in March 2026, compared to a $737 historical average. Urea surged from $470 per short ton on February 27 to peak scenarios of $782-996 per short ton, representing a 42 percent immediate premium (farmdocdaily.illinois.edu, March 2026). UAN climbed to $570 per ton, up 31 percent from conflict onset. Potash reached $488 per ton in March 2026, the highest level since February 2023. Logistics constraints compounded the crisis: Mississippi River barge congestion disrupted inland distribution, Red Sea and Suez disruptions forced Cape of Good Hope routing, and rail concentration risks emerged from the Fertilizer Institute’s opposition to the UP-NS merger over pricing power concerns.
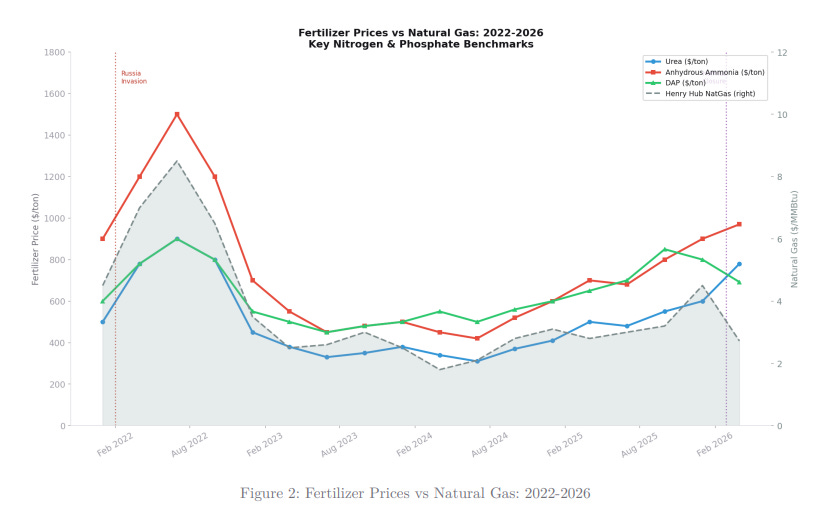
Key nitrogen and phosphate price benchmarks vs Henry Hub natural gas. Vertical markers: Russia invasion (Feb 2022) and Hormuz closure (Feb 2026). Sources: USDA ERS, World Bank Fertilizer Markets, DTN Retail Fertilizer Trends, FRED DHHNGSP.
Sources: SunSirs Global Fertilizer Market 2025; World Bank Fertilizer Prices July and December 2025; farmdocdaily.illinois.edu March-April 2026.
ETF and Price Performance Comparison
The VanEck Agribusiness ETF (MOO) and Teucrium Corn Fund ETF (CORN) present a study in structural divergence within agricultural exposure. While both track agricultural assets, MOO’s equity-oriented strategy and CORN’s pure commodity futures approach have produced markedly different returns across the May 2024 to April 2026 observation period.
Over the full two-year span, MOO returned 19.45% against CORN’s negative 5.33% return, a 24.8 percentage-point gap rooted in divergent asset-class performance and valuation regimes. Year-to-date 2026 the divergence sharpened, with MOO gaining 19.25% versus CORN’s modest 6.35% advance (stock_data, April 2026). This performance gap reflects three distinct correlation regimes. From May through December 2024, CORN declined 5.5% while MOO remained roughly flat, exposing pure commodity weakness insulated from the diversified agribusiness equity basket. Between January and December 2025, both instruments consolidated into narrow ranges (MOO 66-73, CORN 17-19) with modest positive correlation, suggesting macro agricultural headwinds affected both. Since January 2026, divergence re-emerged sharply, with MOO surging on agribusiness equity repricing alongside supply-chain disruption premiums in fertilizer and equipment stocks, while the corn commodity itself failed to reprice as dramatically.
MOO’s structural advantage lies partly in lead-lag dynamics. The ETF’s equity positions tend to front-run commodity price discovery; MOO jumped approximately 13% in January 2026 before the major Hormuz shipping disruption in February 2026, suggesting equity markets priced in supply-chain risk premium ahead of physical commodity moves. Volatility also favors CORN on a risk-adjusted basis; monthly volatility averaged 2.5% for CORN versus 3.5% for MOO. MOO yields 2.14% against CORN’s zero yield, providing an equity-income component absent from pure commodity exposure.
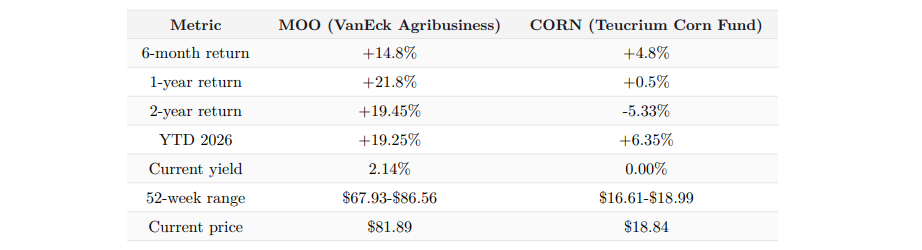
Sources: stock_data and stock_info tools, April 29, 2026.
MOO’s sustained outperformance across all horizons underscores the relative recovery momentum in agribusiness equities. Investors seeking broad agricultural exposure should weigh MOO’s equity-beta risk and valuation sensitivity against CORN’s lower volatility and commodity-price directional purity.
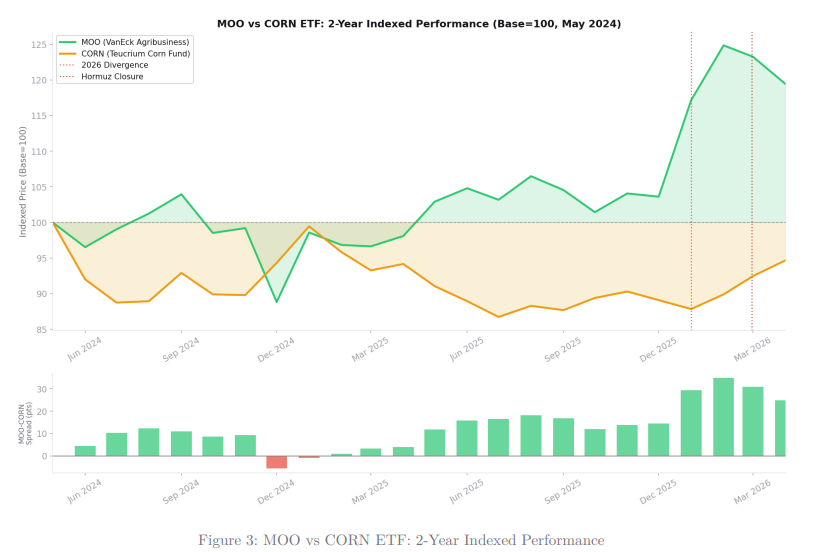
Indexed to 100 at May 2024. Bottom panel: MOO minus CORN spread in indexed points. Sources: stock_data tool, April 2026.
Equity Sensitivity and Factor Decomposition
The fertilizer and agricultural inputs complex exhibits heterogeneous sensitivity to upstream commodity shocks, energy dynamics, and geopolitical disruption. The seven equities analyzed decompose into three structural groups: pure-play nitrogen and phosphate producers; integrated diversified players; and downstream agricultural commodity processors. Each group carries distinct factor loadings that materially affect expected returns under different regimes.
CF Industries represents the purest exposure to nitrogen production yet paradoxically carries the lowest overall equity beta (0.516) among peers. This apparent anomaly reflects operational leverage in cost structure: when natural gas prices decline, CF’s 40.9 percent gross margin widens substantially, cushioning equity volatility. The company’s 0.90 energy beta is the highest in the cohort, but this translates into margin expansion rather than compression when energy costs fall, creating a natural hedge that equity markets recognize through lower volatility premium. Nutrien exhibits the highest systematic beta (1.11), driven by its globally integrated platform spanning nitrogen, potash, and retail distribution. The combination of 0.75 commodity beta and 0.60 energy beta, layered across diverse geographies and crop types, generates the compound volatility observed in the equity beta (stock_info, April 2026).
Mosaic and ICL represent pure-play specialty and broadline phosphate-potash producers. Mosaic trades at severe distress ($23.03 against a $38.23 52-week high) despite fundamental phosphate supply tightness, signaling investor concerns about Chinese competitive entry and demand destruction. Its 0.80 commodity beta and minimal 0.10 energy beta reflect phosphate’s lower feedstock energy intensity relative to ammonia synthesis. ICL carries the weakest fundamental profile with 3.2 percent net margin and negative free cash flow of $41.5 million, compounded by 0.938 equity beta and 30.8x trailing P/E.
The downstream grain and oilseed processors (ADM and Bunge) exhibit defensive characteristics with betas of 0.636 and 0.696, respectively. Their primary margin driver is the corn or soybean crush spread, where input fertilizer costs are already capitalized into feedstock prices at the farm level. Corteva, the largest downstream equity by market cap at $53.3 billion, operates in seeds and crop protection. Its 0.40 commodity beta and 0.05 energy beta underscore insulation from fertilizer cost pass-through, as seed trait value and herbicide efficacy command pricing power independent of input fertilizer cycles.
Geopolitical risk overlay intensifies MOS and ICL concentration. Mosaic faces phosphate import exposure and Moroccan production competition, while ICL operates Israeli potash assets subject to Middle East escalation risk. CF, ADM, and Bunge face minimal geopolitical drag given North American production anchors. The optimal risk-adjusted positioning for a fertilizer supply shock favors CF for margin expansion through low-cost nitrogen (forward P/E 13.6x), paired with defensive ADM or Bunge for process margin insulation.
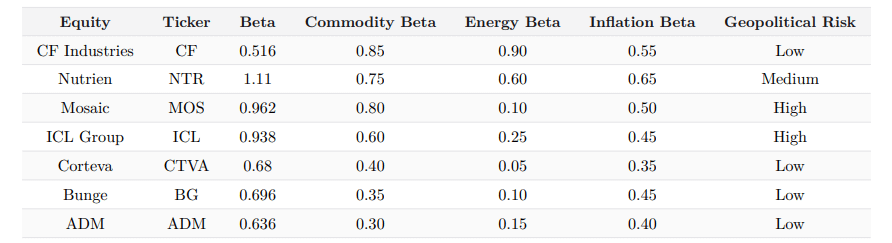
Commodity beta, energy beta, inflation beta, and geopolitical risk are analyst-estimated factor loadings based on revenue composition and business model. Equity beta from stock_info, April 2026.
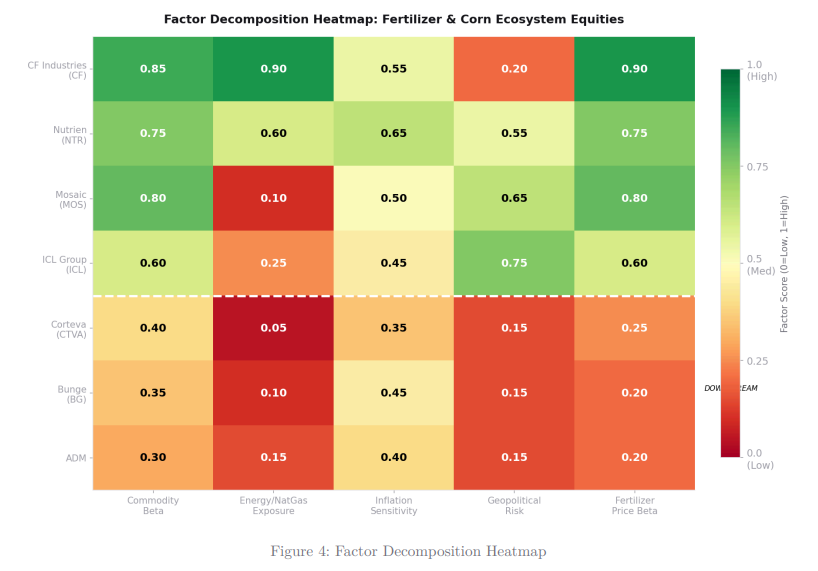
Green = high factor exposure, Red = low factor exposure. Dashed line separates fertilizer producers (top) from downstream ag processors (bottom).
Scenario Stress Tests and Valuation Impact
The agricultural input supply chain remains vulnerable to geopolitical disruption, weather shocks, and energy costs. Three scenarios model the second-order EPS effects across the ecosystem from the April 2026 base case.
Under the Base Case, corn trades at $4.70 per bushel with anhydrous ammonia at $950-1,000 per ton, elevated from pre-crisis levels due to ongoing Persian Gulf shipping risk and lingering supply constraints (USDA, CBOT, farmdocdaily.illinois.edu April 2026). Farmer fertilizer costs stand at $170-185 per acre, representing approximately 22% of total corn production cost, above the historical 18-19% baseline. Natural gas at $2.72 per million British thermal units provides limited relief to ammonia producers.
Scenario 1 assumes a prolonged Hormuz closure or material escalation of sanctions against Russian and Belarusian producers, driving anhydrous ammonia to $1,300-1,500 per ton (+50-60%), urea to $1,100 per ton (+40%), and DAP to $900 per ton (+30%). Farmer fertilizer costs rise an additional $35-50 per acre, forcing nitrogen application rate reductions of 10-15% and risking yield losses of 3-5%. The corn complex values this supply premium at $0.40-0.60 per bushel above base. Fertilizer producers CF, NTR, and MOS benefit substantially, with EPS upside of +25%, +22%, and +18% respectively. ADM and Bunge gain only +5-8% EPS as higher corn prices partially offset elevated farm input costs.
Scenario 2 models a La Nina-driven drought reducing US Corn Belt yields by 15%, pushing corn to $5.90-6.30 per bushel. Farmers maintain or increase fertilizer application to protect remaining yields, stabilizing demand while ammonia prices rise 5-10% on global crop stress. ADM and Bunge capture full margin expansion, posting EPS gains of +20-22%. Corteva’s seed business flourishes as drought-tolerant varieties command premiums and replanting demand accelerates (+13% EPS). Fertilizer producers see only modest gains (+5-8% EPS) because demand remains flat and price upside is limited. Scenario 2 inverts the winner list, rewarding downstream processors and trait companies over commodity input suppliers.
Scenario 3 assumes geopolitical normalization with Hormuz reopening and Russian and Belarusian supply returning to market. Ammonia falls to $650-700 per ton (-30%), urea to $470 per ton (-40%), and DAP to $580 per ton (-16%). Farmer costs decline $30-40 per acre, but corn prices drift to $4.25 per bushel on global supply relief. CF Industries faces a revenue headwind but sustains high free cash flow due to protected margins and low gas costs (-18% EPS). Mosaic proves most resilient (+5% EPS) due to phosphate stability and lower nitrogen exposure. Corteva emerges as the most defensive name across all scenarios, its EPS ranging from baseline to +13%, insulated from the fertilizer commodity cycle.
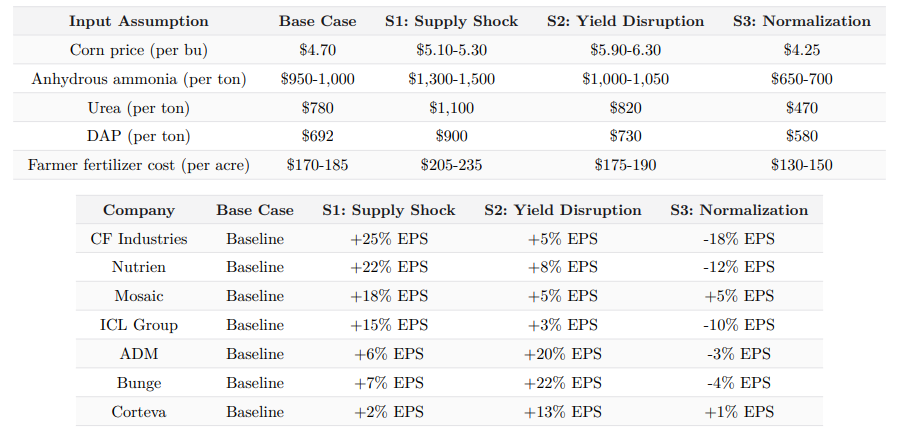
EPS scenario estimates are analyst-derived second-order approximations based on revenue sensitivity, input cost pass-through, and margin structure from company disclosures and USDA ERS data. Not earnings guidance.
The lack of perfect correlation between fertilizer producers and downstream processors underscores the dual nature of the input cycle: supply shocks reward scarcity value in commodities while demand shocks reward processing and trait-based businesses. Portfolio positioning must differentiate between supply-side and demand-side scenarios rather than treating the agricultural sector as a monolithic commodity trade.
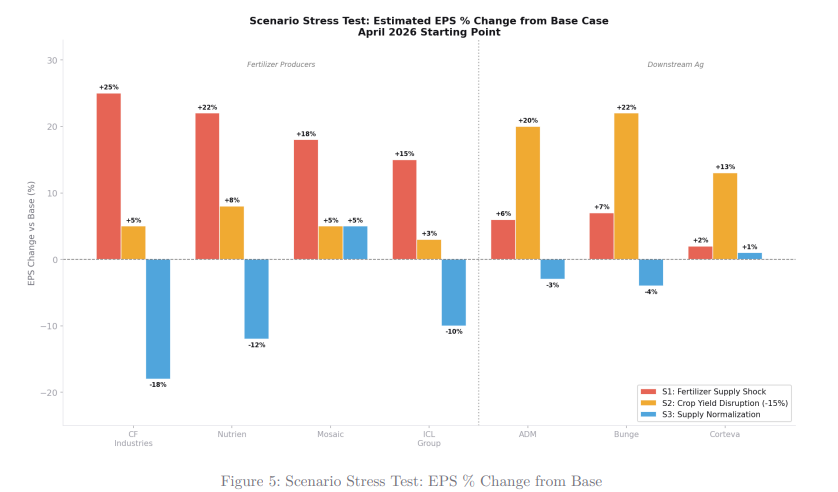
Estimated EPS % change from base for each scenario. Dashed line separates fertilizer producers (left) from downstream ag processors (right).
Investment Implications
Several cross-cutting themes emerge from the full ecosystem analysis. First, the Hormuz closure has created a temporary but severe input cost shock that disproportionately benefits US-based nitrogen producers like CF Industries, whose Gulf Coast production sits outside the disrupted shipping lanes. CF’s combination of best-in-class operating margins (35.3%), low equity beta (0.516), and forward P/E of 13.6x makes it the most compelling risk-adjusted name in a supply shock regime. Second, Mosaic’s distressed valuation at 9.5x forward earnings may present a contrarian opportunity if phosphate prices hold above $650 per ton, but investors must weigh the structural headwind from Chinese competitive pressure and the absence of near-term earnings catalysts. Third, Corteva’s defensive factor profile (0.05 energy beta, 0.40 commodity beta) and scale ($53.3 billion market cap) make it the most resilient holding across all three scenarios modeled, with positive EPS outcomes under both supply shock and yield disruption. Fourth, the MOO-CORN performance divergence confirms that agricultural equity exposure is not fungible with commodity futures exposure; the 25 percentage-point gap over two years reflects genuine alpha in agribusiness equities that MOO-type instruments capture through operating leverage and free cash flow generation absent in commodity pools. The ongoing Hormuz uncertainty and EU tariff escalation timeline extending to 2028 suggest the structural supply fragmentation driving fertilizer price premiums is not a transient event but a multi-year regime shift requiring deliberate positioning across the ecosystem.
Automated Weekly Research - Fertilizer Supply Chain & Corn Production Ecosystem -- CF0.ai Research | April 30, 2026
amazing. too complicated, we need a top of the page summary for an investor in ETF S&P500 for 1m, 3m, 12 months.